Growth science · Growth basics
Normal height & weight by age: what growth charts really mean
Parents almost always arrive at a growth chart with one question — "is my child the right height and weight for their age?" — hoping for a single number. There isn't one. There is no height or weight every healthy child should reach at a given age, and the 50th percentile is not a target. It's simply the middle of a reference group.
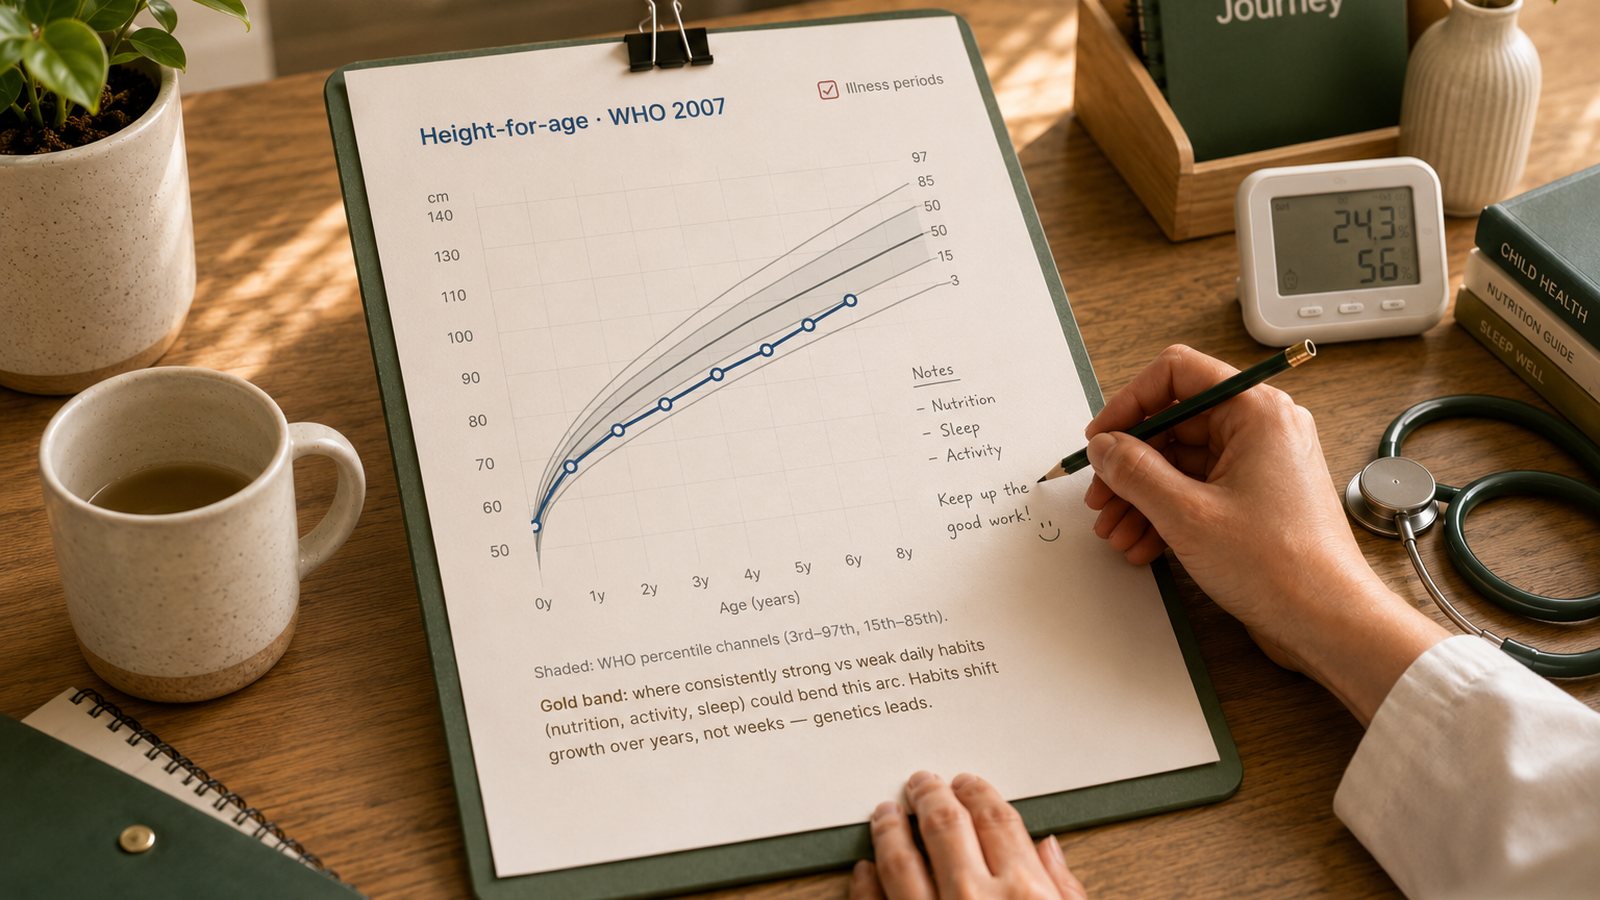
What a chart actually shows is position within a distribution, and what matters is whether a child is following a coherent pattern for their health, family and stage of development. This guide explains how to read that honestly — and a subtle, important point most tables ignore: the chart you choose can change the answer.
1. What a percentile actually means
A percentile is where a measurement sits among children of the same age and sex:
- 50th — the median; half the reference group measured higher, half lower.
- 25th — about 25% measured lower, 75% higher.
- 10th — about 10% measured lower, 90% higher.
It is not a score, a percentage of potential, or a grade of health. Being at the 90th percentile isn’t “better” than the 30th — both are normal positions.
Percentiles and z-scores
Clinicians often use a z-score (standard-deviation score) — how far a measurement is from the median:
| Z-score | ≈ Percentile | Meaning |
|---|---|---|
| +2 | 97th–98th | Unusually high vs the reference |
| +1 | 84th | Above the median |
| 0 | 50th | The reference median |
| −1 | 16th | Below the median |
| −2 | 2nd–3rd | Common screening threshold for “unusually low” |
About 95% of a healthy population falls between −2 and +2. But a value outside that band is a signal to look closer, not a diagnosis — and a child inside it can still need review if their line has slowed or crossed downward.
2. Standard, reference, and “average” are not the same
Three words get used interchangeably and shouldn’t be:
- A growth standard describes how children should grow under healthy conditions. The WHO Child Growth Standards (birth–5 y) are the international example — built from children in six countries raised in good health and feeding conditions, so the curves describe healthy growth, not just observed growth.[1]
- A growth reference describes the observed distribution of a chosen population at a point in time. The WHO 5–19-year curves are a reference, not the same prescriptive standard — reconstructed from older data and linked to the under-5 standards.[2] National charts are references too.
- A population average from a survey is just one number. A proper reference reports medians, percentiles, z-scores and how the sample was measured — far more than an average alone.
One consequence worth internalising: a country can have a lower median for genetic, historical or socioeconomic reasons. The median describes the population; it doesn’t prove the median is biologically ideal for your child.
3. Why the chart you choose changes the answer
This is the part that quietly reassures a lot of parents — especially across Asia, where a child is sometimes measured against a Western-shaped curve and looks “small” who isn’t.
The same child can land at different percentiles on different charts, and the choice can even flip whether a measurement crosses a screening line:
- Applying the US CDC chart to Saudi children produced higher apparent rates of stunting and wasting than the country’s own national chart.[3]
- Applying the WHO standard to Japanese children overestimated short stature (and underestimated overweight) compared with the Japanese reference.[4]
- Across Europe, national height curves vary enough that “European average” depends entirely on which countries and years you include — there’s a real north–south gradient.[5]
Charts also go out of date. Height has shifted markedly over decades — a 50-year analysis found large secular changes in Japan and South Korea — so an old national average can misrepresent children growing today.[6] Whatever chart you use, note which edition and which year.
4. A few orientation numbers (not targets)
Rounded WHO median points, purely for orientation — official tables are calculated by completed month, and your child’s exact percentile needs their exact age and sex:
| Age | Boys median height | Girls median height |
|---|---|---|
| Birth | ~50 cm | ~49 cm |
| 1 year | ~76 cm | ~74 cm |
| 5 years | ~110 cm | ~109 cm |
| 10 years | ~138 cm | ~139 cm |
Notice how close boys and girls are before puberty, and how fast the numbers move — which is exactly why a single measurement means little without age precision and a second point over time.
5. Weight only makes sense next to height
Weight-for-age alone can’t tell you whether a child’s mass suits their frame. Two 10-year-olds at 35 kg — one 132 cm, one 150 cm — have very different builds and BMIs. That’s why WHO stops publishing weight-for-age beyond age 10, and why the useful measures are:
- infancy: weight-for-length;
- young childhood: weight-for-height or BMI-for-age;
- school age and teens: BMI-for-age, read alongside height-for-age.
BMI here is a screening tool, judged by age- and sex-specific z-scores — not adult BMI categories, and not a direct measure of body fat. A muscular or chronically ill child may need extra context.
6. The trajectory beats any single dot
One measurement gives you position. Repeated, accurate measurements give you direction — which is what clinicians actually weigh: current and past height z-scores, the interval between them, annual height velocity, weight and BMI change, puberty stage, and family height.
Rough height-velocity orientation (approximate, not a rule):
- year 1: ~25 cm
- year 2: ~10–12 cm
- ages 2–4: ~7–9 cm/yr
- prepubertal: ~5–6 cm/yr
- puberty: a spurt above the prepubertal rate, timing varies widely
Velocity is very sensitive to measurement error, so points too close together mislead — for a non-urgent check, ~6 months apart is usually more informative than frequent home measuring.
7. Percentile crossing — when it matters
Small movements are normal — in infancy, as a child settles onto their genetic track, near puberty, or when different equipment is used. Look closer when there’s:
- sustained downward movement or loss of height z-score across reliable measurements;
- height slowing with weight loss, or height slowing while weight climbs;
- a marked mismatch with family height, or an unusual pubertal pattern;
- symptoms suggesting chronic illness.
8. Family height is context, not destiny
Parental height helps set expectations. A common estimate of the mid-parental (target) height:
- Boys: (father’s height + mother’s height + 13 cm) ÷ 2
- Girls: (father’s height + mother’s height − 13 cm) ÷ 2
A range is usually placed around it, and population-specific equations can fit better than Western formulas. But treat it as context: a child of shorter parents can be short and perfectly healthy — and “short parents” should never be used to wave away genuine deceleration. We cover prediction properly, honestly, in how tall will my child be?
9. When to talk to a clinician
Worth a professional review if a child:
- is below about the 2nd–3rd percentile, or well below family expectation;
- shows sustained deceleration or crosses downward through percentile channels on reliable measurements;
- has weight falling or rising fast, or height slowing while weight rises;
- has very early or absent puberty for their age, or unusual body proportions;
- was born small and hasn’t caught up; or has growth concerns alongside persistent digestive, respiratory or other symptoms; or takes long-term medication affecting growth.
Two honest caveats in both directions: a height below the 3rd percentile does not mean a hormone problem — most short children are healthy (see is my child too short?). And a height above the 3rd percentile doesn’t rule out a problem if the child’s own trajectory has deteriorated.
10. Using an online table well
A percentile tool is for orientation, not diagnosis. A good one asks for date of birth, measurement date, sex, height, weight, method and ideally previous measurements — and names the reference it used. It should not promise extra adult height, label a child abnormal from one home measurement, imply the 50th is optimal, merge all Asian or Middle Eastern children into one curve, or infer growth-plate status from a height number.
Plotted honestly, against the right yardstick
GrowSense charts your child's height on WHO percentiles, labels what's measured versus estimated, and tracks the trajectory over time — not just a single dot. National reference charts (so a child is compared with their own population, not a Western-shaped curve) are on the way. The goal isn't to chase the 50th percentile — it's to see a steady, sensible growth path.
Explore GrowSenseThe bottom line
“Normal” isn’t a number beside an age. WHO gives the shared international frame — a standard from birth to five, a reference from five to nineteen — and national charts answer a different, local question. Because the chart you pick can move a percentile and even a screening threshold, the honest read always names the reference, uses exact age and sex, interprets weight next to height, and — above all — watches the trajectory over time. A percentile tells you where a measurement sits. The path it’s on tells you the thing you actually want to know.
References
A. WHO growth systems
- World Health Organization. WHO Child Growth Standards (length/height-for-age, weight-for-age, weight-for-length/height, BMI-for-age), birth to 5 years. Geneva: WHO; based on the Multicentre Growth Reference Study.
- World Health Organization. Growth reference data for 5–19 years (height-for-age, weight-for-age to 10 y, BMI-for-age). Geneva: WHO; 2007.
B. Why the chart you choose matters
- El Mouzan MI, Al Herbish AS, Al Salloum AA, et al. Comparison of the 2005 growth charts for Saudi children and adolescents to the 2000 CDC growth charts. Ann Saudi Med. 2008;28(5):334–340. PMID: 18779639.
- Inokuchi M, Matsuo N, Takayama JI, Hasegawa T. WHO 2006 Child Growth Standards overestimate short stature and underestimate overweight in Japanese children. J Pediatr Endocrinol Metab. 2018;31(1):33–38. PMID: 29267170.
- Bonthuis M, van Stralen KJ, Verrina E, et al. Use of national and international growth charts for studying height in European children. PLoS One. 2012;7(8):e42506. PMID: 22916131.
- Cole TJ, Mori H. Fifty years of child height and weight in Japan and South Korea: contrasting secular trend patterns. Am J Hum Biol. 2018;30(1):e23054. PMID: 28833849.
This article is educational and provides population-level reference information. It cannot determine whether an individual child's growth is normal, or diagnose a nutritional, hormonal or other condition. Unexpected measurements or changes should be discussed with a qualified pediatric healthcare professional.